One of the recurring concerns that our customers raise with us is the amount of downtime required when we make a change to the application.
We have spent time and money putting a bunch of high availability technologies in place so it always seems disappointing to have to ask for downtime to do something as simple as an application code change. Somehow this fairly frequent activity has not caught the attention of the folks who think up clever new ways to improve database availability... until now.
In our case the application is a Telecoms inventory solution based on the Amdocs Cramer product using J2EE (WebLogic or Oracle App Server) and an Oracle database. The product is very 'database heavy' in that a large proportion of its code resides in the database as Oracle stored procedures or database resident Java code. The complexity of the dependencies inside the product means that any changes typically require an outage of several hours while the database code is replaced and recompiled.
We have looked at various ways to solve this problem. The main option being to run multiple instances of the application and replicate data changes between them somehow. When upgrade time arrives, one instance can be used to apply the code changes while the other stays online running transactions and the data changes are replicated across before the instance with the updated code takes over as the live instance. We've looked at Oracle streams, Data Guard SQL Apply and GoldenGate as possible solutions. All of them seemed to offer the possibility of doing the job but somehow the complexity and cost always meant that the idea was never followed through to implementation.
There is now another way to achieve the same result - without the need for a separate instance of the application. Oracle 11g release 2 has introduced a feature called 'Edition-Based Redefinition'. The new feature allows multiple versions of the same procedure to exist in the database so that clients can carry on using the old version while the new one is being built. The new versions can also be kept
separate during testing and if necessary even run in parallel for longer periods of time.
Edition-Based Redefinition is probably still some way in the future for us at the moment - I think it will need changes by our product vendor, not least that they need to support Oracle 11g.
Some links containing more detail:-
A 2 part YouTube video with Bryn Llewellyn
Part 1
Part 2
Tom Kyte's very thorough explanation of Edition-Based Redefinition
Part 1
Part 2
Part 3
Bryn Llewellyn's White Paper
The Manual
Friday, 13 August 2010

Friday, 30 April 2010
Memory Leak Case Studies Part 3
The third and final installment (probably) in the series on memory leak case studies describing real memory leaks and similar Java heap stress conditions that I’ve seen myself and how they were tracked down and fixed.
This particular issue took a long time to resolve because it wasn't in code that we controlled and tracking down information about the problem proved very difficult.
weblogic.jms.dd.DDMember
After clustering our WebLogic 9.2 servers we found that the managed servers would run into major heap stress and sometimes go offline on some of our test environments. Unfortunately the problem was not easily reproducible and didn't seem to happen on environments that we could easily mess with.
A heap histogram from jmap looked like...
255076744 2969890 char[]
71728608 2988692 java.lang.String
34196104 287745 * ConstMethodKlass
30874880 385936 weblogic.jms.dd.DDMember
20721808 287745 * MethodKlass
18528600 772025 weblogic.jms.common.JMSID
18527736 771989 weblogic.messaging.dispatcher.DispatcherId
15454080 386352 weblogic.cluster.BasicServiceOffer
14538712 24883 * ConstantPoolKlass
12604000 259169 * SymbolKlass
10601304 24883 * InstanceKlassKlass
9763528 29806 byte[]
9262056 385919 weblogic.jms.dd.DDMemberStatusSharer
7797008 18852 * ConstantPoolCacheKlass
6628720 118370 org.codehaus.groovy.runtime.metaclass.MetaMethodIndex$Entry
6175856 385991 weblogic.jms.common.JMSServerId
We also got some heap dumps, but it was pretty obvious from the outset that the memory leak related to WebLogic internal classes. We checked and ruled out the obvious things that were under our control (e.g. too many messages building up in JMS queues). We also googled for the problem and searched Oracle Metalink but didn't turn up any useful advice. The only option left was to raise a case with Oracle, which is what we did.
Oracle responded to the case with the advice to increase the heap size to 2Gb on all servers. We did this and our test environments became more stable. the problem did not recur in test so eventually the clustering changes made it into production.
I'm sure that you can guess where this story is going ...
After clustering went live we found that the managed servers would stay up for roughly 24 hours before running into problems and needing to be restarted. The initial symptoms that were noticed were BEA-000115 messages (which say that a multicast packet was lost) and BEA-000511 messages (which say unsolicited reply), along with high CPU utilisation.
Naturally a new Oracle case was opened. Initially it was thought that the problem was being caused by a poor choice of multicast addresses. Another week went by while the system was reconfigured with what seemed to be better multicast addresses, but still the problem remained.
I did some analysis of the logs using Splunk (a great tool BTW, but that's another story) and found that the messages seemed to appear in bursts starting an hour or two before the CPU utilisation became really high. Here is a Splunk graph showing the occurrences of one of the message types.

I'd also asked for jstat data which confirmed that the servers were filling up their heaps. I also found that the WebLogic logs contained some BEA-310002 messages that shed some light on the behaviour of the problem over a longer period. I used splunk to produce a graph from these:-

This graph seemed to indicate that the problem was related to the uptime of the servers rather than the amount of work they were doing (the behaviour was the same on a Sunday as on a working day). This prompted an idea for improving the stability of our system - avoid restarting all of the servers at the same time and then there would be a good chance that they wouldn't all fail at the same time. Unfortunately the change control procedures for the production system pretty much ruled this out, so we were stuck with restarting the servers each time they ran into trouble.
Finally Oracle support came back to us with the advice that this was a known bug in WebLogic for which a patch was available - 'BUG 8160383 - [CR368242]'. We applied this fix, tested it and put it into production and found that the problem was solved.
So I then wondered why we hadn't found the cause sooner. The Oracle support people said that the description of the patch said that it fixes "leaking objects weblogic.jms.dd.DDMember". I went back into Metalink and looked up the information relating to the bug and the patch and found that it contained mostly blank text and no mention at all of 'DDMember' which is probably why I couldn't find it. I wonder whether some of the information was perhaps lost in the transition from WebLogic's bug database into Metalink. Clearly the Oracle support people have another source of information available to them.
This particular issue took a long time to resolve because it wasn't in code that we controlled and tracking down information about the problem proved very difficult.
weblogic.jms.dd.DDMember
After clustering our WebLogic 9.2 servers we found that the managed servers would run into major heap stress and sometimes go offline on some of our test environments. Unfortunately the problem was not easily reproducible and didn't seem to happen on environments that we could easily mess with.
A heap histogram from jmap looked like...
255076744 2969890 char[]
71728608 2988692 java.lang.String
34196104 287745 * ConstMethodKlass
30874880 385936 weblogic.jms.dd.DDMember
20721808 287745 * MethodKlass
18528600 772025 weblogic.jms.common.JMSID
18527736 771989 weblogic.messaging.dispatcher.DispatcherId
15454080 386352 weblogic.cluster.BasicServiceOffer
14538712 24883 * ConstantPoolKlass
12604000 259169 * SymbolKlass
10601304 24883 * InstanceKlassKlass
9763528 29806 byte[]
9262056 385919 weblogic.jms.dd.DDMemberStatusSharer
7797008 18852 * ConstantPoolCacheKlass
6628720 118370 org.codehaus.groovy.runtime.metaclass.MetaMethodIndex$Entry
6175856 385991 weblogic.jms.common.JMSServerId
We also got some heap dumps, but it was pretty obvious from the outset that the memory leak related to WebLogic internal classes. We checked and ruled out the obvious things that were under our control (e.g. too many messages building up in JMS queues). We also googled for the problem and searched Oracle Metalink but didn't turn up any useful advice. The only option left was to raise a case with Oracle, which is what we did.
Oracle responded to the case with the advice to increase the heap size to 2Gb on all servers. We did this and our test environments became more stable. the problem did not recur in test so eventually the clustering changes made it into production.
I'm sure that you can guess where this story is going ...
After clustering went live we found that the managed servers would stay up for roughly 24 hours before running into problems and needing to be restarted. The initial symptoms that were noticed were BEA-000115 messages (which say that a multicast packet was lost) and BEA-000511 messages (which say unsolicited reply), along with high CPU utilisation.
Naturally a new Oracle case was opened. Initially it was thought that the problem was being caused by a poor choice of multicast addresses. Another week went by while the system was reconfigured with what seemed to be better multicast addresses, but still the problem remained.
I did some analysis of the logs using Splunk (a great tool BTW, but that's another story) and found that the messages seemed to appear in bursts starting an hour or two before the CPU utilisation became really high. Here is a Splunk graph showing the occurrences of one of the message types.

I'd also asked for jstat data which confirmed that the servers were filling up their heaps. I also found that the WebLogic logs contained some BEA-310002 messages that shed some light on the behaviour of the problem over a longer period. I used splunk to produce a graph from these:-
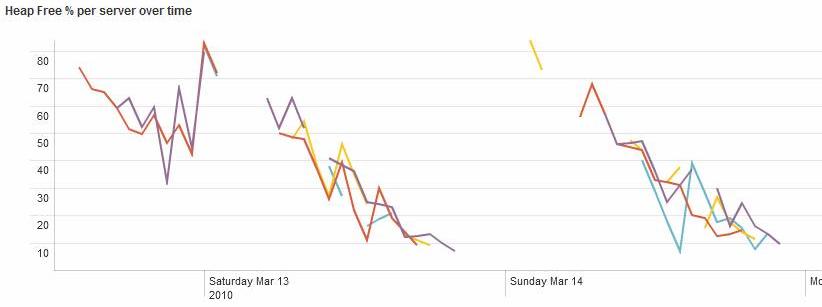
This graph seemed to indicate that the problem was related to the uptime of the servers rather than the amount of work they were doing (the behaviour was the same on a Sunday as on a working day). This prompted an idea for improving the stability of our system - avoid restarting all of the servers at the same time and then there would be a good chance that they wouldn't all fail at the same time. Unfortunately the change control procedures for the production system pretty much ruled this out, so we were stuck with restarting the servers each time they ran into trouble.
Finally Oracle support came back to us with the advice that this was a known bug in WebLogic for which a patch was available - 'BUG 8160383 - [CR368242]'. We applied this fix, tested it and put it into production and found that the problem was solved.
So I then wondered why we hadn't found the cause sooner. The Oracle support people said that the description of the patch said that it fixes "leaking objects weblogic.jms.dd.DDMember". I went back into Metalink and looked up the information relating to the bug and the patch and found that it contained mostly blank text and no mention at all of 'DDMember' which is probably why I couldn't find it. I wonder whether some of the information was perhaps lost in the transition from WebLogic's bug database into Metalink. Clearly the Oracle support people have another source of information available to them.
Wednesday, 31 March 2010
A Performance Cake
My customer bought the team a cake to celebrate hitting a performance target. That was nice - I never had a performance cake before. Very tasty. Thank you Pieter for the cake and John for the photo.


Monday, 8 February 2010
Memory Leak Case Studies Part 2
The second in the series of case studies describing real memory leaks and similar Java heap stress conditions that I’ve seen myself and how they were tracked down and fixed.
Oracle OC4J oracle.dms.spy.Metric
An application which I’d seen running quite happily on other app servers was giving problems when run on Oracle App Server (OC4J). It would run for a few days and then performance would gradually degrade. A quick check using JVM startup switches to log garbage collection activity showed that increasing GC overhead was the most likely culprit.
A heap histogram showed several oracle.dms classes near to the top of the list. DMS is an instrumentation technology from Oracle that allows various aspects of the app server and application operation to be monitored.
Size Count Class description
-------------------------------------------------------
115136200 813639 char[]
19947648 831152 java.lang.String
19887720 497193 oracle.dms.spy.Metric
13815944 244485 java.lang.Object[]
9190608 67578 oracle.dms.instrument.PhaseEvent
8412640 50732 * MethodKlass
5134584 91689 oracle.dms.spy.Metric[]
3735840 155660 java.util.ArrayList
3635952 15771 byte[]
3601048 79404 * SymbolKlass
3484080 43551 oracle.dms.instrument.Noun
2890560 24088 oracle.dms.instrument.State
2880624 120026 java.util.Hashtable$Entry
2656648 4659 * ConstantPoolKlass
2108424 87851 java.util.Vector
1925072 26967 java.util.HashMap$Entry[]
1643280 4659 * InstanceKlassKlass
We became convinced that this was an app server rather than an application issue but it took a few days for us to track down the correct fix. Googling turned up some ways to switch off the reporting of DMS metrics which we tried, but these did not solve the problem because the metrics were still being captured. Eventually I found the fix rather by chance – there is an option which can be set using a JVM startup switch to disable the collection of DMS metrics for JMS. The switch is ‘-Doc4j.jms.noDms=true’. We tried this and found that the problem was solved.
Annoyingly we then found that this was a known issue with OC4J documented in Metalink bug id 5462430 and fixed in OAS version 10.1.2.99. I say annoyingly because I’d searched Metalink several days earlier and had seen this bug but had misread the OC4J version number and decided that it wasn’t the same as our problem.
AxisHttpSession
A GUI application using a complex Java servlet had been working just fine in production for over 12 months. Recently it had started to suffer from Java heap stress, causing it to fail if the server component was left running for several weeks.
Our immediate workaround was to schedule a restart of the server component each weekend. We also collected a heap dump file before each restart.
Analysis of the heap dump using Eclipse MAT didn’t immediately show an obvious culprit. This was because the server was now being restarted every week, so the problem was not building up to the point where it would be really obvious in the heap dump.
Once this point was understood, further analysis showed that the server appeared to be leaking Apache Axis objects. Classes org.apache.axis.transport.http.AxisHttpSession and org.apache.axis.handlers.soap.SOAPService were both showing retaining big chunks of heap space, although appearing at positions 18 and 19 in the MAT histogram.

A search of the Axis bug database highlighted a similar looking problem - http://issues.apache.org/jira/browse/AXIS-2314 . Checking our Axis JAR manifest revealed that we (or rather a bought in product) were using Axis 1.3 which was too old to have the fix for this bug. We have asked the product vendor to provide a patch to use a later version of Axis.
This still left the question of why the problem had started happening after the system had been stable for so long. The reason was traced to a recent implementation of SiteMinder single sign on. This change had required that the Java applet configuration be changed so that instead of using Java RMI to communicate with the server it started using SOAP and therefore Apache Axis.
Oracle OC4J oracle.dms.spy.Metric
An application which I’d seen running quite happily on other app servers was giving problems when run on Oracle App Server (OC4J). It would run for a few days and then performance would gradually degrade. A quick check using JVM startup switches to log garbage collection activity showed that increasing GC overhead was the most likely culprit.
A heap histogram showed several oracle.dms classes near to the top of the list. DMS is an instrumentation technology from Oracle that allows various aspects of the app server and application operation to be monitored.
Size Count Class description
-------------------------------------------------------
115136200 813639 char[]
19947648 831152 java.lang.String
19887720 497193 oracle.dms.spy.Metric
13815944 244485 java.lang.Object[]
9190608 67578 oracle.dms.instrument.PhaseEvent
8412640 50732 * MethodKlass
5134584 91689 oracle.dms.spy.Metric[]
3735840 155660 java.util.ArrayList
3635952 15771 byte[]
3601048 79404 * SymbolKlass
3484080 43551 oracle.dms.instrument.Noun
2890560 24088 oracle.dms.instrument.State
2880624 120026 java.util.Hashtable$Entry
2656648 4659 * ConstantPoolKlass
2108424 87851 java.util.Vector
1925072 26967 java.util.HashMap$Entry[]
1643280 4659 * InstanceKlassKlass
We became convinced that this was an app server rather than an application issue but it took a few days for us to track down the correct fix. Googling turned up some ways to switch off the reporting of DMS metrics which we tried, but these did not solve the problem because the metrics were still being captured. Eventually I found the fix rather by chance – there is an option which can be set using a JVM startup switch to disable the collection of DMS metrics for JMS. The switch is ‘-Doc4j.jms.noDms=true’. We tried this and found that the problem was solved.
Annoyingly we then found that this was a known issue with OC4J documented in Metalink bug id 5462430 and fixed in OAS version 10.1.2.99. I say annoyingly because I’d searched Metalink several days earlier and had seen this bug but had misread the OC4J version number and decided that it wasn’t the same as our problem.
AxisHttpSession
A GUI application using a complex Java servlet had been working just fine in production for over 12 months. Recently it had started to suffer from Java heap stress, causing it to fail if the server component was left running for several weeks.
Our immediate workaround was to schedule a restart of the server component each weekend. We also collected a heap dump file before each restart.
Analysis of the heap dump using Eclipse MAT didn’t immediately show an obvious culprit. This was because the server was now being restarted every week, so the problem was not building up to the point where it would be really obvious in the heap dump.
Once this point was understood, further analysis showed that the server appeared to be leaking Apache Axis objects. Classes org.apache.axis.transport.http.AxisHttpSession and org.apache.axis.handlers.soap.SOAPService were both showing retaining big chunks of heap space, although appearing at positions 18 and 19 in the MAT histogram.

A search of the Axis bug database highlighted a similar looking problem - http://issues.apache.org/jira/browse/AXIS-2314 . Checking our Axis JAR manifest revealed that we (or rather a bought in product) were using Axis 1.3 which was too old to have the fix for this bug. We have asked the product vendor to provide a patch to use a later version of Axis.
This still left the question of why the problem had started happening after the system had been stable for so long. The reason was traced to a recent implementation of SiteMinder single sign on. This change had required that the Java applet configuration be changed so that instead of using Java RMI to communicate with the server it started using SOAP and therefore Apache Axis.
Monday, 30 November 2009
Memory Leak Case Studies Part 1
I’ve been planning to post a little more on memory leak hunting for some time. For some reason (not from my own choice!) it has been a recurring theme of my professional life for the past year or so. What I had in mind was a few brief case studies of real memory leaks and similar Java heap stress conditions that I’ve seen myself and how they were tracked down and fixed. I hope these might help someone faced with similar issues so here goes...
I won’t describe the symptoms that started the investigation for each issue separately – they are usually the same – high CPU usage caused by too much garbage collection activity, sometimes leading up to java.lang.OutOfMemoryError.
If you need any more detail on the tools and techniques used, please see my earlier postings.
The case studies are roughly in chronological order. The first two are below. The rest will be in later postings. I've tried to stick to what actually happened, including any theories that turned out to be wrong. Where I would do things differently with the benefit of hindsight or better tools, I've tried to point this out too.
HSQLDB MemoryNode
A recently developed component was falling over during performance testing. In this case the heap histogram was pretty clear:-
Object Histogram:
Size Count Class description
-------------------------------------------------------
853118944 644449 char[]
44002832 361196 * ConstMethodKlass
26010200 361196 * MethodKlass
18582256 31995 * ConstantPoolKlass
15542520 647605 java.lang.String
14955048 395252 java.lang.Object[]
13799984 31995 * InstanceKlassKlass
13799360 431230 org.hsqldb.MemoryNode
13701992 283429 * SymbolKlass
10192768 24725 * ConstantPoolCacheKlass
8900360 37575 byte[]
7836032 85528 java.util.HashMap$Entry[]
6703232 65651 int[]
6520920 116445 org.codehaus.groovy.runtime.metaclass.MetaMethodIndex$Entry
The key here is org.hsqldb.MemoryNode. Our applications normally use Oracle but one part of the new component made use of an HSQLDB database to keep a record of the transactions that had been received. This caused no problems in development or test, but caused the application to fall over during performance testing because far more log records were being created, all of which were kept in memory by HSQLDB. To make matters worse, HSQLDB had been configured to save the database to a disk file and reload it on startup, so the problem could also build up across several restarts of the application.
In this case we were able to solve the problem by changing the application configuration to disable the logging feature and clearing out all of the accumulated HSQLDB rows.
Oracle T4CVarcharAccessor
A complex EJB based application was failing during performance test at high volumes. The heap histogram showed several Oracle JDBC driver classes high up in the list.
1,171,400,136 265,576 char[]
138,464,419 31,011 byte[]
13,216,708 255,522 int[]
8,717,148 47,897 oracle/jdbc/driver/T4CVarcharAccessor
6,226,876 259,451 java/lang/String
4,418,140 27,273 oracle/jdbc/driver/T4CNumberAccessor
4,402,466 29,138 short[]
2,548,884 17,748 [Ljava/lang/Object;
2,502,556 104,271 java/util/HashMap$Entry
2,075,776 2,221 oracle/jdbc/driver/T4CPreparedStatement
1,982,236 23,840 [Ljava/util/HashMap$Entry;
This problem was more difficult to track down because our code wasn’t creating or running the JDBC statements – this was all happening in an EJB server that we were calling. This was part of a commercial product that we we use and we didn't have the source code.
Looking at some heap dumps using the IBM HeapAnalyzer appeared to show that the offending objects were being held in memory by the WebLogic JDBC statement cache. While this could have created symptoms like a small scale memory leak, this explanation didn’t quite make sense because we were seeing far more leaking statements than the cache size. This is a good example of a tool presenting a summarised view of a complex world which can sometimes lead us astray. Eventually we stopped blaming WebLogic and found a different way to look for clues...
The breakthrough came with the use of ‘strings’ and ‘sort’ to analyse the heap dumps. This allowed us to pinpoint a piece of SQL that was repeatedly appearing on the heap and not being garbage collected. The problem turned out to be a simple program logic bug in the EJB server – it worked just fine in the majority of cases when it generated and ran just one JDBC statement for each client call. On some calls, however, it would generate and run two statements. When this happened it would only call close() on the most recent one, causing the JDBC driver to leak the resources belonging to the earlier statements. We raised a bug with the product vendor and after several calls to explain the issue and our diagnosis, they shipped us a fix.
Finding the root cause for this issue took several weeks. It would have been a lot easier with Eclipse MAT.
I won’t describe the symptoms that started the investigation for each issue separately – they are usually the same – high CPU usage caused by too much garbage collection activity, sometimes leading up to java.lang.OutOfMemoryError.
If you need any more detail on the tools and techniques used, please see my earlier postings.
The case studies are roughly in chronological order. The first two are below. The rest will be in later postings. I've tried to stick to what actually happened, including any theories that turned out to be wrong. Where I would do things differently with the benefit of hindsight or better tools, I've tried to point this out too.
HSQLDB MemoryNode
A recently developed component was falling over during performance testing. In this case the heap histogram was pretty clear:-
Object Histogram:
Size Count Class description
-------------------------------------------------------
853118944 644449 char[]
44002832 361196 * ConstMethodKlass
26010200 361196 * MethodKlass
18582256 31995 * ConstantPoolKlass
15542520 647605 java.lang.String
14955048 395252 java.lang.Object[]
13799984 31995 * InstanceKlassKlass
13799360 431230 org.hsqldb.MemoryNode
13701992 283429 * SymbolKlass
10192768 24725 * ConstantPoolCacheKlass
8900360 37575 byte[]
7836032 85528 java.util.HashMap$Entry[]
6703232 65651 int[]
6520920 116445 org.codehaus.groovy.runtime.metaclass.MetaMethodIndex$Entry
The key here is org.hsqldb.MemoryNode. Our applications normally use Oracle but one part of the new component made use of an HSQLDB database to keep a record of the transactions that had been received. This caused no problems in development or test, but caused the application to fall over during performance testing because far more log records were being created, all of which were kept in memory by HSQLDB. To make matters worse, HSQLDB had been configured to save the database to a disk file and reload it on startup, so the problem could also build up across several restarts of the application.
In this case we were able to solve the problem by changing the application configuration to disable the logging feature and clearing out all of the accumulated HSQLDB rows.
Oracle T4CVarcharAccessor
A complex EJB based application was failing during performance test at high volumes. The heap histogram showed several Oracle JDBC driver classes high up in the list.
1,171,400,136 265,576 char[]
138,464,419 31,011 byte[]
13,216,708 255,522 int[]
8,717,148 47,897 oracle/jdbc/driver/T4CVarcharAccessor
6,226,876 259,451 java/lang/String
4,418,140 27,273 oracle/jdbc/driver/T4CNumberAccessor
4,402,466 29,138 short[]
2,548,884 17,748 [Ljava/lang/Object;
2,502,556 104,271 java/util/HashMap$Entry
2,075,776 2,221 oracle/jdbc/driver/T4CPreparedStatement
1,982,236 23,840 [Ljava/util/HashMap$Entry;
This problem was more difficult to track down because our code wasn’t creating or running the JDBC statements – this was all happening in an EJB server that we were calling. This was part of a commercial product that we we use and we didn't have the source code.
Looking at some heap dumps using the IBM HeapAnalyzer appeared to show that the offending objects were being held in memory by the WebLogic JDBC statement cache. While this could have created symptoms like a small scale memory leak, this explanation didn’t quite make sense because we were seeing far more leaking statements than the cache size. This is a good example of a tool presenting a summarised view of a complex world which can sometimes lead us astray. Eventually we stopped blaming WebLogic and found a different way to look for clues...
The breakthrough came with the use of ‘strings’ and ‘sort’ to analyse the heap dumps. This allowed us to pinpoint a piece of SQL that was repeatedly appearing on the heap and not being garbage collected. The problem turned out to be a simple program logic bug in the EJB server – it worked just fine in the majority of cases when it generated and ran just one JDBC statement for each client call. On some calls, however, it would generate and run two statements. When this happened it would only call close() on the most recent one, causing the JDBC driver to leak the resources belonging to the earlier statements. We raised a bug with the product vendor and after several calls to explain the issue and our diagnosis, they shipped us a fix.
Finding the root cause for this issue took several weeks. It would have been a lot easier with Eclipse MAT.
Thursday, 1 October 2009
A Better Heap Analysis Tool
Sometimes I wonder how a really useful tool can be out there for over a year before I find it. I can't answer that question. I can tell my readers a little about it...
I recently found the Eclipse Memory Analyzer project (or 'MAT'). This is a tool which combines most of the best features of IBM's HeapAnalyzer, features from SAP and JHat (for example, OQL) plus a bunch of other useful things into a single tool. It also indexes your heap dump and saves the indexes so that when you reopen the same dump later it loads very quickly.

MAT uses the notion of a 'Dominator' which I suspect comes from the SAP contributions - this is an object which if removed would free up a bunch of other objects. I think this is slightly different from the IBM HeapAnalyzer's notion of 'owner'. Having used the IBM tool, it takes a little bit of effort to get used to MAT's Dominator concept, but once you do this it makes perfect sense. So far I've found that I miss the freedom with which you can navigate up and down the owner/parent/child relationships in HeapAnalyzer - MAT makes you use a few more clicks to do this. On the whole though, it is a much better tool than its predecessors.
The thing I really like about MAT is its ability to do String frequency analysis (plus other useful stuff like finding sparsely populated collections) and to be able to focus this analysis onto children of a particular class or a particular part of the heap (or both!) - no need for separate analysis using 'strings' any more.
MAT is available either as an Eclipse plugin or a standalone tool. My own preference is for the standalone tool version - I have way too many plugins in my Eclipse workbench already and for heap analysis I prefer to have lean and mean tools so that memory is kept free for doing the real work.
MAT comes with excellent tutorials and also a blog containing good ideas about how to use it to track down those pesky memory leaks.
I think this will be my tool of choice from now on.
I recently found the Eclipse Memory Analyzer project (or 'MAT'). This is a tool which combines most of the best features of IBM's HeapAnalyzer, features from SAP and JHat (for example, OQL) plus a bunch of other useful things into a single tool. It also indexes your heap dump and saves the indexes so that when you reopen the same dump later it loads very quickly.

MAT uses the notion of a 'Dominator' which I suspect comes from the SAP contributions - this is an object which if removed would free up a bunch of other objects. I think this is slightly different from the IBM HeapAnalyzer's notion of 'owner'. Having used the IBM tool, it takes a little bit of effort to get used to MAT's Dominator concept, but once you do this it makes perfect sense. So far I've found that I miss the freedom with which you can navigate up and down the owner/parent/child relationships in HeapAnalyzer - MAT makes you use a few more clicks to do this. On the whole though, it is a much better tool than its predecessors.
The thing I really like about MAT is its ability to do String frequency analysis (plus other useful stuff like finding sparsely populated collections) and to be able to focus this analysis onto children of a particular class or a particular part of the heap (or both!) - no need for separate analysis using 'strings' any more.
MAT is available either as an Eclipse plugin or a standalone tool. My own preference is for the standalone tool version - I have way too many plugins in my Eclipse workbench already and for heap analysis I prefer to have lean and mean tools so that memory is kept free for doing the real work.
MAT comes with excellent tutorials and also a blog containing good ideas about how to use it to track down those pesky memory leaks.
I think this will be my tool of choice from now on.
Friday, 18 September 2009
How to find Java Memory Leaks - Part 3
In the previous post I looked at how to get a heap histogram and how to use it to help to understand the cause of a memory leak. While a heap histogram will tell you what is leaking, it doesn't provide many clues about why. For the (probably) final installment, I will look at how to perform a more in-depth analysis using a heap dump. This is most definitely in the 'advanced' category of debugging.
A heap dump is a diagnostic file containing information about the entire contents of the heap. As a result, it can be a pretty big file - very roughly it will be about the same size as the space used on the heap. Before going any further you need to make sure that you have enough disk space to allow the heap dump to be written. If you are going to analyse it somewhere else (which is probably a good idea) then you need to check that you will be able to transfer such a big file.
Next, my usual warning - this level of debugging is very intrusive and will hang the JVM for several seconds so you should reproduce your issue on a test environment and take heap dumps there.
There are several ways to get a heap dump... and the options depend on which JVM version you have. Because I often need to work with 1.4 and 1.5, I usually use a JVM startup switch -XX:+HeapDumpOnCtrlBreak . Depending on your JVM version, you can also trigger a heap dump using jmap (e.g. jmap -heap:format=b), jconsole or via JMX. I've seen some very long pauses (several minutes) when using jmap like this, so be warned. There is another JVM startup switch -XX:-HeapDumpOnOutOfMemoryError which should be fairly self-explanatory. I've never used this myself because I usually want to control when heap dumps are taken and am always worried that triggering a heap dump when the JVM is already in trouble might make things even worse.
So having got your heap dump, how do you analyse it? The most frequently quoted tool is jhat from Sun. This will read your heap dump file and start a web server. You can then connect a browser to it to analyse your heap dump. I'm not going to say much more about jhat because I have not used it very often.
Naturally there are commercial tools but I wont cover them here. My own (free) tool of choice is called HeapAnalyzer from IBM. This is a Java Swing application which provides most of the capabilities available in jhat (with the notable exception of OQL) and also provides some useful power tools for quickly homing in on a memory leak - basically this tool has the feel of having been written by people who have actually spent some serious time tracking down memory leaks.
Whichever tool you choose, you will probably need to make sure that the tool itself has enough heap space by using the -Xmx option with a suitably high value when starting the tool.
Here is a screenshot of HeapAnalyzer just after opening a heap dump.

If you're lucky then the the first view that HeapAnalyzer shows will highlight your leak in blue. Before we look at this in more detail, let's look at some other views that will help us to understand what HeapAnalyzer is telling us.
 View/Root List - this shows all of the 'top level' objects that will stay on the heap without being referred to by another object. This view (and the others) is sorted by 'total size' which needs a little explanation. This number is not the same as the total size of the object on the heap. HeapAnalyzer tries to do something more useful than that...
HeapAnalyzer organizes all objects as 'parent' and 'child' based on their references (the target of a reference is called the 'child'). The total size is the sum of the sizes of the object itself and all of the children that it owns. This is useful and often works in a way that seems natural, but since the heap is just a bunch of objects that refer to each other, it doesnt always present things in the way that you might expect, especially in the presence of circular reference chains (which happens quite a lot). It also tracks which objects have already been visited when working this out, so if an object has more than one 'parent', its size will only be counted under one of them, which HeapAnalyzer nominates as the 'owner'. HeapAnalyzer has to make a fairly arbitrary choice of which parent to count as the owner which may or may not be what you would consider to be 'correct'. Keep this final point in mind when using HeapAnalyzer.
 View/Type List - this is very similar to the info provided by the heap histogram which I described in part 2. HeapAnalyzer also adds its 'total size' column. This is a view that I use a lot - once I find a class that is of interest, I can right click on it and select 'Find Same Type' which takes me to the...
 View/Object List - this shows a list of object instances, again ordered by 'total size'. Once you have found an object which is of interest, you can right click and select 'Find Object in Tree View' to jump to the...
 View/Tree View - this is probably the most useful view of all. It allows you to see an object in the context of its parents (or to be precise, owner) and children. Children are ordered by total size, so the ones that HeapAnalyzer thinks are using the most space show up at the top of the list of children. The tree view also allows you to view (in the right hand pane) the values of each attribute of the object.
Be careful with the tree view - keep in mind that it is presenting a simple view of something which is actually more complex than it appears. Each object can have multiple parents but the tree view can only show one of them (the one HA picked as the 'owner'). You can see the other parents by right clicking the object and selecting 'List Parents'.
And finally the tools - by right clicking an object in the tree view we have the option to 'go to the largest drop in subtrees' - i.e. find the point in the tree of children that is accounting for the most heap space. At the top of the view we have the 'Subpoena Leak Suspects' tool which will jump to the objects that HA has decided are the most likely candidates as leaking objects. This brings us back to the initial view that I described above because this is where HA will go to when the heap dump is first opened.
HeapAnalyzer also comes with a reasonably comprehensive help page which describes most of the key features.
So what can HA tell us? Unfortunately it still can't tell us why we have a memory leak. What it can do is allow us to home in on the leaking objects and understand which other objects are holding references to them and keeping them in the heap. Working out why we have a leak is something that we have to use our own brains to do, for example by figuring out where the code should be resetting a reference and making the objects eligible for garbage collection. This may be both difficult and time consuming. You will also need to decide which 'leaks' are actually object caches which are working as intended and eliminate these from your list of suspects... maybe. Sometimes object caches may be incorrectly tuned or misbehaving so they may really be the cause of the leak.
Finally I'd like to mention one more (and rather simpler) technique. As I observed earlier, string data is usually the thing which takes up most heap space. Looking at the content of those strings may provide a better clue about your memory leak. So use the Unix 'strings' command on the heap dump, followed by 'sort'. This will give you a big text file which you can analyze to find out which are the most commonly occurring strings. I've used this in the past to track down a JDBC related leak by finding the most common SQL statements on the heap.
There are a few pitfalls with the 'strings' approach:-
A heap dump is a diagnostic file containing information about the entire contents of the heap. As a result, it can be a pretty big file - very roughly it will be about the same size as the space used on the heap. Before going any further you need to make sure that you have enough disk space to allow the heap dump to be written. If you are going to analyse it somewhere else (which is probably a good idea) then you need to check that you will be able to transfer such a big file.
Next, my usual warning - this level of debugging is very intrusive and will hang the JVM for several seconds so you should reproduce your issue on a test environment and take heap dumps there.
There are several ways to get a heap dump... and the options depend on which JVM version you have. Because I often need to work with 1.4 and 1.5, I usually use a JVM startup switch -XX:+HeapDumpOnCtrlBreak . Depending on your JVM version, you can also trigger a heap dump using jmap (e.g. jmap -heap:format=b), jconsole or via JMX. I've seen some very long pauses (several minutes) when using jmap like this, so be warned. There is another JVM startup switch -XX:-HeapDumpOnOutOfMemoryError which should be fairly self-explanatory. I've never used this myself because I usually want to control when heap dumps are taken and am always worried that triggering a heap dump when the JVM is already in trouble might make things even worse.
So having got your heap dump, how do you analyse it? The most frequently quoted tool is jhat from Sun. This will read your heap dump file and start a web server. You can then connect a browser to it to analyse your heap dump. I'm not going to say much more about jhat because I have not used it very often.
Naturally there are commercial tools but I wont cover them here. My own (free) tool of choice is called HeapAnalyzer from IBM. This is a Java Swing application which provides most of the capabilities available in jhat (with the notable exception of OQL) and also provides some useful power tools for quickly homing in on a memory leak - basically this tool has the feel of having been written by people who have actually spent some serious time tracking down memory leaks.
Whichever tool you choose, you will probably need to make sure that the tool itself has enough heap space by using the -Xmx option with a suitably high value when starting the tool.
Here is a screenshot of HeapAnalyzer just after opening a heap dump.

If you're lucky then the the first view that HeapAnalyzer shows will highlight your leak in blue. Before we look at this in more detail, let's look at some other views that will help us to understand what HeapAnalyzer is telling us.
 View/Root List - this shows all of the 'top level' objects that will stay on the heap without being referred to by another object. This view (and the others) is sorted by 'total size' which needs a little explanation. This number is not the same as the total size of the object on the heap. HeapAnalyzer tries to do something more useful than that...
HeapAnalyzer organizes all objects as 'parent' and 'child' based on their references (the target of a reference is called the 'child'). The total size is the sum of the sizes of the object itself and all of the children that it owns. This is useful and often works in a way that seems natural, but since the heap is just a bunch of objects that refer to each other, it doesnt always present things in the way that you might expect, especially in the presence of circular reference chains (which happens quite a lot). It also tracks which objects have already been visited when working this out, so if an object has more than one 'parent', its size will only be counted under one of them, which HeapAnalyzer nominates as the 'owner'. HeapAnalyzer has to make a fairly arbitrary choice of which parent to count as the owner which may or may not be what you would consider to be 'correct'. Keep this final point in mind when using HeapAnalyzer.
 View/Type List - this is very similar to the info provided by the heap histogram which I described in part 2. HeapAnalyzer also adds its 'total size' column. This is a view that I use a lot - once I find a class that is of interest, I can right click on it and select 'Find Same Type' which takes me to the...
 View/Object List - this shows a list of object instances, again ordered by 'total size'. Once you have found an object which is of interest, you can right click and select 'Find Object in Tree View' to jump to the...
 View/Tree View - this is probably the most useful view of all. It allows you to see an object in the context of its parents (or to be precise, owner) and children. Children are ordered by total size, so the ones that HeapAnalyzer thinks are using the most space show up at the top of the list of children. The tree view also allows you to view (in the right hand pane) the values of each attribute of the object.
Be careful with the tree view - keep in mind that it is presenting a simple view of something which is actually more complex than it appears. Each object can have multiple parents but the tree view can only show one of them (the one HA picked as the 'owner'). You can see the other parents by right clicking the object and selecting 'List Parents'.
And finally the tools - by right clicking an object in the tree view we have the option to 'go to the largest drop in subtrees' - i.e. find the point in the tree of children that is accounting for the most heap space. At the top of the view we have the 'Subpoena Leak Suspects' tool which will jump to the objects that HA has decided are the most likely candidates as leaking objects. This brings us back to the initial view that I described above because this is where HA will go to when the heap dump is first opened.
HeapAnalyzer also comes with a reasonably comprehensive help page which describes most of the key features.
So what can HA tell us? Unfortunately it still can't tell us why we have a memory leak. What it can do is allow us to home in on the leaking objects and understand which other objects are holding references to them and keeping them in the heap. Working out why we have a leak is something that we have to use our own brains to do, for example by figuring out where the code should be resetting a reference and making the objects eligible for garbage collection. This may be both difficult and time consuming. You will also need to decide which 'leaks' are actually object caches which are working as intended and eliminate these from your list of suspects... maybe. Sometimes object caches may be incorrectly tuned or misbehaving so they may really be the cause of the leak.
Finally I'd like to mention one more (and rather simpler) technique. As I observed earlier, string data is usually the thing which takes up most heap space. Looking at the content of those strings may provide a better clue about your memory leak. So use the Unix 'strings' command on the heap dump, followed by 'sort'. This will give you a big text file which you can analyze to find out which are the most commonly occurring strings. I've used this in the past to track down a JDBC related leak by finding the most common SQL statements on the heap.
There are a few pitfalls with the 'strings' approach:-
- Double byte character sets - try using different flavours of the '-e' switch to do another run of 'strings' to pick up double byte strings.
- Multi-line strings - what may be a single string object in Java will become multiple lines in your text file. Sorting the text file will then redistribute these lines so that parts of the same Java string are widely separated.
- Relating the content to anything in HeapAnalyzer - I haven't found a good way to do this. It would be nice if HA had a string content search feature.
Subscribe to:
Posts (Atom)

 Posts
Posts


