Monday, 31 January 2011

Dashboards for Production Monitoring

We've been using CA Wily Introscope to monitor one of our production systems for several years. Some dashboards had been developed when the tool was first installed and these have been in use ever since. These dashboards provided useful information, but had been built from a technical perspective and didn't really reflect the way that we usually think about our system. For example, the top level dashboard showed items like 'JMS Subsystem' and 'Java Heap'. When one of these indicated an issue, it wasn't really very clear which service was being impacted… and in some cases whether there was really a problem at all.

Following the experience with Wily for performance test monitoring (see last month's posting) I decided to spend some time creating some new dashboards that were a better match for the way we think about our system - i.e. as a collection of services each one of which might be working well or having some problems. I therefore wanted a top-level dashboard with one traffic light indicator for each of our key services and drill-down into a more detailed dashboard for each individual service to allow problems to be tracked down. I will return to this later.

This posting describes what I wanted to do, what I did and what I learned in the process. It's mostly about Wily but other tools are available so I hope (dear reader) that the principles described would apply reasonably well to a different tool.

Individual Service Dashboards

To figure out whether an individual service is working properly we need to monitor several things…
  • What is the response time of the service and is it within acceptable limits?
  • What is the throughput for the service?
  • For a JMS messaging service, how many messages are sat in the queue?
  • For a JMS service, does the queue have one or more listeners connected?
  • Are there any messages in the error queue?
  • Is the application reporting an abnormal number of errors?
All of the above are available in what Wily terms the 'front end' or in the JMX data for the relevant JMS destination.

Our application is clustered, so in most cases I needed to create a Metric Group to bring together the numbers for a particular metric from each member of the cluster. For most of these I then created an Alert to contain the threshold values that would trigger an amber or red warning.

Sometimes I was able to find a Service Level Agreement (SLA) to set the alert thresholds. In cases where there was no SLA I used the Wily Investigator to get a picture of the average and maximum values for the metric over the past month and set thresholds based on this.

For some metrics (e.g. throughput) it was not appropriate to create an Alert. For the error alerts on our user interface I needed to ask Wily to count how many occurrences happened in a given period of time (e.g. 5 minutes) because in many cases a small error rate is quite normal and acceptable.

The service dashboards typically contain a graph to track the values of each metric across all managed servers plus a traffic light showing the status of the alert. In most cases I found it best to bind the graph to the alert rather than the metric group so that I got an amber and a red line on the graph to show the trigger points for each alert like the example below.


Laying out the dashboards was challenging in some cases and for some more complex services I needed to resort to multiple layers of drill-down to show all of the graphs that were needed. In some cases I did this by having a higher level dashboard with 'throughput', 'response time' and 'queue backlog' panels and providing drill-down to more detailed dashboards from here. For other services it was more appropriate to break the service down into functional elements (sub-services) and provide a second level drill-down dashboard for each of these. Here's an example.


Top Level Dashboards

Wily allows us to combine individual alerts into higher level summary alerts - in multiple tiers if necessary. This is exactly what I did to create the top level dashboard and also for the summary dashboard where I broke things down into sub-services. The top level dashboard with one traffic light per service is shown below. I also added a CPU usage graph below the traffic lights for information (and because there was some free space).


Tricky Things

So far so good, but not everything went totally as I wanted…
  • I couldn't find a way to combine metrics using any kind of logic - for example if I wanted to raise an alert if a queue had zero listeners AND had a non-zero message count.
  • I have not so far found any way to turn cumulative metrics (e.g. events since startup) into a number of events per interval. This would be very useful for some JMX metrics that are only available as a cumulative number.
  • For WebLogic JMS queues it is really necessary to know both the 'current' message count and the 'pending' (i.e. being processed or buffered for delivery) count and to sum these together. It is possible to do this using Wily calculators but this gets complicated in a cluster because we really need a separate calculator per metric per cluster member… which is pretty time-consuming to set up. In practice I have ignored the pending count in most cases - except for those parts of the application where it is really critical.
  • Debugging summary alerts can be a bit tricky - I found one that kept going amber or red on the top level dashboard but after drilling down into the detailed dashboard everything was green. In the end I traced it to a duplicate alert that was misconfigured and not shown on the dashboard but it took a lot of manual checking to track this down.
  • Wily can't 'see' everything. This isn't really a tool issue, but it does mean that 'green' on the Wily dashboard doesn't necessarily mean that everything is fine. For example, some parts of our application keep internal 'transaction queues' in application database tables and other parts use background jobs in the database which may go wrong in interesting ways without Wily having any visibility. The Wily Oracle Agent might help here, but at the moment we don't have it installed.
Future Possibilities

As I said at the beginning, my dashboard is focused on monitoring the services supported by our application. As a result, the dashboards focus on the 'front end' metrics. Wily also provides a lot of visibility of the 'back end' (e.g. JDBC calls into Oracle) and infrastructure (e.g. Java garbage collector behaviour) but none of these are used by my dashboards. I figured that if there is a backend issue then it must have a visible effect on the front end service otherwise it isn't really an issue at all. I would therefore expect the dashboard to detect a problem and flag it as an amber or red condition. It would, of course, be nice to be able to drill down and isolate this problem to the database (or whatever), but I've left that as a possible improvement for the future.

Friday, 24 December 2010

JRockit Mission Control vs Wily - Postscript

We've just completed our project to performance test an Apache Camel integration solution hosted on WebLogic. I thought it would be useful to write a few words about our experiences using JRMC and Wily to monitor the tests as a postscript to 'JRockit Mission Control vs Wily'

CA Wily Introscope

We wound up using Wily for most of our monitoring needs in the WebLogic tier. On the whole it did the job that we expected of it very well.

Our main thoughts on our Wily experience are...
  • The fact that Wily's monitoring is 'always on' was a big advantage, as well as the ability to get historical results in graphical or CSV format.
  • We were not able to use any custom probes because Wily was installed and configured by the customer's infrastructure team and getting custom probes created, tested and deployed was just going to need too many phone calls and email round trips.
  • Initially there were quite a lot of navigation steps and other clicking around needed to capture all of the metrics that we needed into graphs or CSV form. We largely overcame this by creating some metric groupings and custom dashboards to bring all of the necessary data together into one place.
  • For some reason, the JMX data from the Camel route MBeans was not captured by Wily during our tests (although the processor MBeans worked fine and the route MBeans worked fine before we started the tests).
  • Wily didn't recognise our Apache CXFServlet as a 'Frontend' (but it knew it was a Servlet) nor did it recognise outbound web service and TIBCO calls as 'Backends', so some of the more advanced features (e.g. transaction tracing) were not usable.
  • Wily often picks a non-intuitive sampling interval for graphs (e.g. 6 minutes) but it was quite easy to override this and use something more sensible.
  • Data captured from JMX MBeans needed some further analysis afterwards to calculate the throughput and average response times during the test period. It may have been possible to use Wily calculators to automate this, but we didn't have time to get that far

JRockit Mission Control

We had a couple of issues with JRMC right from the start. These were probably not faults with the tool, but they severely limited its usefulness
  • Our customer had an older version of JRockit than that supported by the latest version of JRMC, so we needed to downgrade to JRMC 3.1.2 before most of the JRMC features would work.
  • We never managed to get any kind of recording capability to work. JRMC 3.1.2 has JRA recording, but whenever we tried this it would cause the WebLogic managed server to go into an 'UNKNOWN' state and stop working. I've tested JRA recording on my local setup and it works fine, so this issue seems to be specific to our customer's managed WebLogic setup. It may have been fixable but we didn't get this far.
So in the end we used Wily for most of our WebLogic monitoring needs. The biggest gap in our Wily capability was measurement of callouts by the application to other web services. These were not being made directly by Camel components, so we had no visibility using JMX either.

We were able to use JRMC to fill this gap by using JRMC method profiling to trap the web service and TIBCO callouts. This wasn't a perfect setup because it could only give us an average response time for the whole test. It also had a few other issues:-
  • Someone needs to remember to start the method profiler before the test and save the results afterwards.
  • It isn't easy to share JRMC method profiling configurations (or any other JRMC configuration) with other team members, so each person had to set the probes up manually.
  • Only one person can use method profiling on a managed server at a time. If someone accidentally starts profiling while another session is in progress the first session is terminated.
  • We had one occasion on which the Windows machine running JRMC automatically rebooted itself part way through a 24 hour test run so we lost all of the JRMC data prior to the reboot.
It would have been nice to have been able to use the latest version of JRMC and be able to use all of the features, but circumstances dictated otherwise.

Summary

On the whole, our experience has reinforced my original conclusions that JRMC is a good tool for single developers or testers to quickly get a handle on how their Java code is performing but that Wily is much stronger in a team environment or for production monitoring.

In the end it wasn't an 'either/or' decision for us - we needed to use both tools to capture the data that we needed.

Wednesday, 17 November 2010

How Fast is my Camel?

I'm working on a project using Apache Camel to do some web service and messaging bus transformation and integration. My part of the project is mainly concerned with performance testing, so I needed to figure out how we could measure the performance of various components within our Camel setup - both in terms of how our integration piece was performing and also how the various services on which we depend were performing.

For those not familiar with Camel you can find an overview here

To figure out how to make these measurements I set up a couple of sample contexts and routes and deployed them into a WebLogic 10.3 server. For no particularly good reason, both provide a service based on the Spring Web Services echo sample.

One route is based on the Camel CXF sample and uses a CXF endpoint, a custom transformation bean and a custom backend bean to generate the response.


The second route uses the Camel HTTP components to provide a servlet and then proxy the SOAP call to the same app running on another (Jetty) app server.


What we need to measure is:-
  • how many times is each component/route called in a given time period?
  • how long does each route take to respond back to the client?
  • where is the response time being spent? - in our own components or in calls to other systems?
I will look at two ways to make these performance measurements in this posting - using JMX and by trapping and measuring invocations to individual Java mathods. Because the project is using JRockit, I will be showing how to make these measurements using JRockit Mission Control (JRMC), but the techniques are equally applicable to other tools.

JMX

I was pleasantly surprised to find a bunch of Camel related JMX MBeans appear in the JRMC console without any need for me to make any changes to the application. Camel enables JMX by default and it seems that it also creates some usable default MBeans for each component.


Browsing through these it seems that most of them relate to the configuration of the Camel components rather than their runtime behaviour. Some of these include options to turn tracing on or off and reconfigure the detail level - useful but not quite what we are looking for. The two relevant parts of the tree for performance measurement are 'routes' and 'processors' because both of these contain invocation counts and timings. As their name suggests, 'routes' relates to the behaviour of the entire route and 'processors' to the behaviour of some individual components. The 'processors' tree doesnt cover every component - things like servlets that receive messages via HTTP and initiate the route processing are not available here, but their response time will in most cases equate to the response time of the whole route.

Below is a screenshot of one of the components in my proxying route showing the attributes that will alow us to monitor the number of invocations and response time. You can see the two custom MBeans in the echo_context route and the HTTP client in the servlet_echo_context route. Unfortunately the names of the MBeans don't seem to be very meaningful, but by browsing into the attributes it is usually possible to figure out which one is which. The attributes provided by the route level MBean are very similar.


We can therefore use JMX to monitor the performance of our Camel routes and individual components.

If you press the 'Visualize' button, you can also chart the value of one or more MBean attributes to see how they change over time. The chart will appear on the 'General' view in the console, soomething like the one below...


(Incidentally, if you want to graph behaviour over time and be able to zoom in and out etc then I think that Wily Introscope does a much better job - see my post comparing JRMC and Wily)

I noticed one bit of strangeness - the HTTP client MBean seems to report double the number of invocations that I would expect - each time the route runs the HTTP client's 'ExchangesTotal' count goes up by two.

Profiling Traps

The JMX MBeans will probably serve most of our day to day needs, but sometimes I expect we will want to 'drill down' a bit further to investigate performance issues. For this purpose, we can place traps or probes into the code which can make measurements at a level of detail lower than those provided by JMX.

These traps can be inserted using Aspect Oriented Programming technologies such as aspectj, Spring's built in AOP capabilities or using a monitoring tool such as Wily or JRMC.

If you want to use this approach, you need to have some knowledge of the code of the framework that you are using. You can get this by browsing the Javadocs or the source code itself or by running your app in a debugger, placing breakpoints at 'interesting' places and examining the call stack. Setting up a debugger takes some time, but I think it provides the answers that I want more quickly than trying to figure things out from the documentation or the source.

Here are some methods where I've placed traps to try out this technique...
  • org.apache.cxf.transport.servlet.AbstractHTTPServlet.handleRequest(HttpServletRequest, HttpServletResponse) - The entry point into my CXF driven route
  • org.apache.camel.component.http.CamelServlet.service(HttpServletRequest, HttpServletResponse) - The entry point into my HTTP servlet driven route
  • org.apache.camel.component.http.HttpProducer.executeMethod(HttpMethod) - The point where my HTTP servlet driven proxying route calls out to an external server
  • my own custom bean methods
The above points will capture data similar to that captured by JMX. These can be used along with the source code as a starting point for 'drilling down' into the detail.

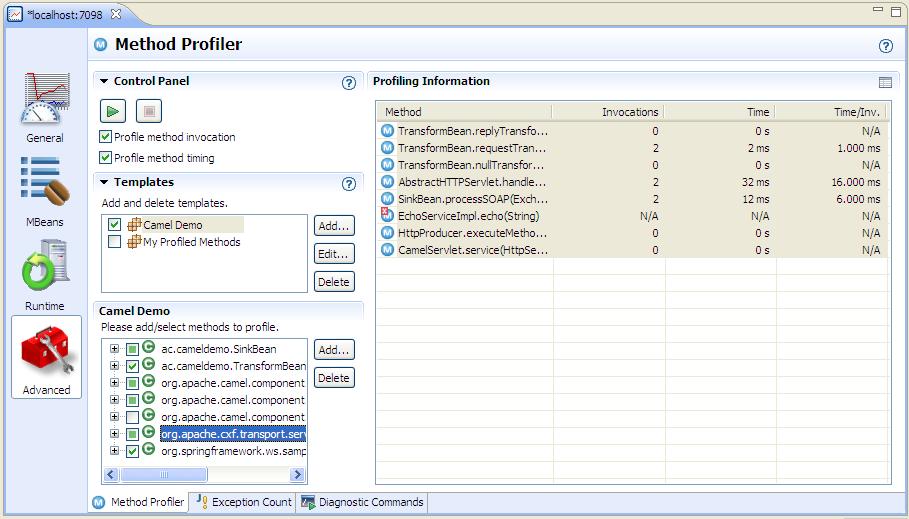
Creating profiling traps in JRMC is fairly simple - go to the 'Advanced' view in the console and click the 'Add...' button under 'select methods to profile. JRMC will ask you for the class name. Assuming that the class is found, it will then allow you to select the methods that you want to profile.

Once the methods are selected, you need to click the 'Start Profiling' button (green triangle) to start capturing data. You should see something like the screenshot below.


Profiling traps can be used to get a more detailed picture of where response time is being sent. They are more complex to set up than JMX and probably incur some measurement overhead. They do have one other big drawback - they are based only on class and method, so you won't be able to separate out the stats for different component instances if you have a number of routes using the same type of component. For all of these reasons, method profiling is probably best restricted to very targeted tests in which you can focus your workload and your profiling traps purely on a small area of interest.

Sunday, 31 October 2010

JRockit Mission Control vs Wily

We’ve been using CA Wily Introscope to monitor one of our production systems for a couple of years. It has been very useful in providing a detailed insight into what is going on with the Java tier including the ability to look back in time and do root cause analysis after a problem has happened.

In particular, we use Wily to monitor the throughput and response time of our ‘front ends’ (servlets, EJBs etc), the ‘back end’ (JDBC calls) as well as keeping an eye on key JMX metrics such as the number of messages in JMS queues and the behaviour of the heap and garbage collector. All in all, it’s a very useful tool that I wouldn’t like to be without.


Another customer that I’ve been working with more recently has suggested either Wily or Oracle JRockit Mission Control (JRMC) as monitoring solutions. I’ve mostly worked with the Sun JVM until now so I didn’t know much about JRMC. I decided to try to figure out how it stacked up against Wily.


This post is about my first impressions of JRMC and its suitability for my own needs. I wouldn’t claim that it’s a comprehensive comparison, so please forgive any errors or omissions.

Pros
  • It’s much easier to get a copy of JRMC than Wily
  • No interceptor setup needed
  • Easier to use for a 'quick look'
  • Probably a better tool for general profiling when you’re not sure where a performance issue might be
  • I like the ‘wait events’ profiling – this seems rather similar to what an Oracle AWR report shows in the database… it remains to be seen whether it proves as useful in the Java tier.
  • Looks like it has some useful features for diagnosing memory leaks, but I’ll reserve judgement until I’ve used them on a real life problem.
  • Can trigger thread/heap dumps etc from the same console
  • Probably better targeted garbage collection visibility for JRockit
Cons
  • Many features only work with the JRockit 1.6 VM
  • It doesn’t seem to support the notion of a centralized permanent data repository
  • Without a data repository, I suspect that any long term trend reporting will be very difficult
  • It doesn’t seem to have the capability to build ‘traffic light’ dashboards and drill down from these to the detailed monitoring data
In summary, I think that both Wily and JRMC are useful tools. JRMC probably scores more highly on more detailed JVM analysis and ease of getting started. Wily does a better job of monitoring a production system and historical trend reporting.

My first choice would be to have both tools available. If I had to choose between them I’d probably stick with Wily for production system monitoring and possibly go for JRMC for monitoring performance tests.

Tuesday, 14 September 2010

Capturing Local Network Traffic on Windows

I often find myself using a network packet sniffer to capture traffic between two network applications. This can be a very powerful technique, both for debugging and for diagnosing performance issues because it shows exactly what is happening on the wire without any need for debugging or logging code in the application and without any room for doubt that the debugging code may itself be causing a problem or not showing the issue.

One serious limitation with this technique is that it is not usually possible to monitor traffic between two applications running on the same Windows machine. I think that the reason is that the Windows loopback adapter doesn’t support packet sniffing. This is rather a pain for me because I quite often want to look at two network applications ‘in captivity’ by running them on my laptop.

Until recently I had just accepted this limitation and found other ways around it such as using another machine to run one of the applications, but this needs extra effort to get the application working on another machine. Sometimes I simply abandoned the packet sniffing route and tried to solve the problem using other techniques.

I recently wanted to monitor and debug some Oracle database link traffic. Installing Oracle on another machine was really going to be overkill so I spent some time thinking about other ways to see the traffic.

I figured out a very simple way around the problem that allows packet sniffing without installing one of the applications on a different machine. The basic principle is to make the network traffic from the client go to a different machine and then have that machine send the traffic back to the target application. This forces the traffic between the two applications ‘onto the wire’ where it can be captured by a packet sniffer (Wireshark in my case). In my setup the extra machine is running Linux, but it should be possible to adapt this technique for other operating systems.

I tried a couple of ways to do this without success before settling on a really simple answer. The first two ways should also work and may be more suitable in some situations. Having found a simpler way, I didn’t pursue them further, but here they are:-
  1. Use iptables port forwarding to identify the relevant network packets and route them back to the intended host.
  2. Use netcat as an application level proxy configured to open a TCP connection to the target host when it receives an inbound connection and forward traffic in both directions.
The technique that I settled on doesn’t require any clever stuff on the Linux machine:-
  1. Use Putty on the Windows machine to open an SSH session onto the Linux machine and log in.
  2. Create a tunnel in Putty, providing a free port number (let’s say we choose 8521) on the Windows machine as the ‘source port’ and the IP address of the Windows machine and the real port number of the application (e.g. 1521) as the ‘destination’
  3. Reconfigure the client application to talk to localhost:8521
  4. Set up the packet sniffer to capture network traffic on the real application port number (1521).
  5. Run the client application and watch the packets arrive.
The screenshot below shows the Putty settings window with the tunnel info being set up. Don't forget to click the 'Add' and then 'Apply' buttons or else it won't work.


This works because Putty listens on port 8521 on the Windows box, sends all traffic received over to the Linux box via its SSH connection and then opens a connection from the Linux box back to port 8521 on the Windows box. The server application and packet sniffer both see a connection coming from the Linux box and send all responses back the same way, even though the client is really on the Windows box.

Step 3 is of course very dependant on the client application. In the case of a database link the ‘client’ is actually an Oracle database instance. I had to set up an extra aliased entry in tnsnames.ora and create a database link to talk to the aliased TNS name instead of going direct to the real target instance.

Friday, 13 August 2010

An End in Sight to Upgrade Downtime?

One of the recurring concerns that our customers raise with us is the amount of downtime required when we make a change to the application.

We have spent time and money putting a bunch of high availability technologies in place so it always seems disappointing to have to ask for downtime to do something as simple as an application code change. Somehow this fairly frequent activity has not caught the attention of the folks who think up clever new ways to improve database availability... until now.

In our case the application is a Telecoms inventory solution based on the Amdocs Cramer product using J2EE (WebLogic or Oracle App Server) and an Oracle database. The product is very 'database heavy' in that a large proportion of its code resides in the database as Oracle stored procedures or database resident Java code. The complexity of the dependencies inside the product means that any changes typically require an outage of several hours while the database code is replaced and recompiled.

We have looked at various ways to solve this problem. The main option being to run multiple instances of the application and replicate data changes between them somehow. When upgrade time arrives, one instance can be used to apply the code changes while the other stays online running transactions and the data changes are replicated across before the instance with the updated code takes over as the live instance. We've looked at Oracle streams, Data Guard SQL Apply and GoldenGate as possible solutions. All of them seemed to offer the possibility of doing the job but somehow the complexity and cost always meant that the idea was never followed through to implementation.

There is now another way to achieve the same result - without the need for a separate instance of the application. Oracle 11g release 2 has introduced a feature called 'Edition-Based Redefinition'. The new feature allows multiple versions of the same procedure to exist in the database so that clients can carry on using the old version while the new one is being built. The new versions can also be kept
separate during testing and if necessary even run in parallel for longer periods of time.

Edition-Based Redefinition is probably still some way in the future for us at the moment - I think it will need changes by our product vendor, not least that they need to support Oracle 11g.

Some links containing more detail:-

A 2 part YouTube video with Bryn Llewellyn
Part 1
Part 2

Tom Kyte's very thorough explanation of Edition-Based Redefinition
Part 1
Part 2
Part 3

Bryn Llewellyn's White Paper

The Manual

Friday, 30 April 2010

Memory Leak Case Studies Part 3

The third and final installment (probably) in the series on memory leak case studies describing real memory leaks and similar Java heap stress conditions that I’ve seen myself and how they were tracked down and fixed.

This particular issue took a long time to resolve because it wasn't in code that we controlled and tracking down information about the problem proved very difficult.

weblogic.jms.dd.DDMember

After clustering our WebLogic 9.2 servers we found that the managed servers would run into major heap stress and sometimes go offline on some of our test environments. Unfortunately the problem was not easily reproducible and didn't seem to happen on environments that we could easily mess with.

A heap histogram from jmap looked like...

255076744 2969890 char[]
71728608 2988692 java.lang.String
34196104 287745 * ConstMethodKlass
30874880 385936 weblogic.jms.dd.DDMember
20721808 287745 * MethodKlass
18528600 772025 weblogic.jms.common.JMSID
18527736 771989 weblogic.messaging.dispatcher.DispatcherId
15454080 386352 weblogic.cluster.BasicServiceOffer
14538712 24883 * ConstantPoolKlass
12604000 259169 * SymbolKlass
10601304 24883 * InstanceKlassKlass
9763528 29806 byte[]
9262056 385919 weblogic.jms.dd.DDMemberStatusSharer
7797008 18852 * ConstantPoolCacheKlass
6628720 118370 org.codehaus.groovy.runtime.metaclass.MetaMethodIndex$Entry
6175856 385991 weblogic.jms.common.JMSServerId

We also got some heap dumps, but it was pretty obvious from the outset that the memory leak related to WebLogic internal classes. We checked and ruled out the obvious things that were under our control (e.g. too many messages building up in JMS queues). We also googled for the problem and searched Oracle Metalink but didn't turn up any useful advice. The only option left was to raise a case with Oracle, which is what we did.

Oracle responded to the case with the advice to increase the heap size to 2Gb on all servers. We did this and our test environments became more stable. the problem did not recur in test so eventually the clustering changes made it into production.

I'm sure that you can guess where this story is going ...

After clustering went live we found that the managed servers would stay up for roughly 24 hours before running into problems and needing to be restarted. The initial symptoms that were noticed were BEA-000115 messages (which say that a multicast packet was lost) and BEA-000511 messages (which say unsolicited reply), along with high CPU utilisation.

Naturally a new Oracle case was opened. Initially it was thought that the problem was being caused by a poor choice of multicast addresses. Another week went by while the system was reconfigured with what seemed to be better multicast addresses, but still the problem remained.

I did some analysis of the logs using Splunk (a great tool BTW, but that's another story) and found that the messages seemed to appear in bursts starting an hour or two before the CPU utilisation became really high. Here is a Splunk graph showing the occurrences of one of the message types.


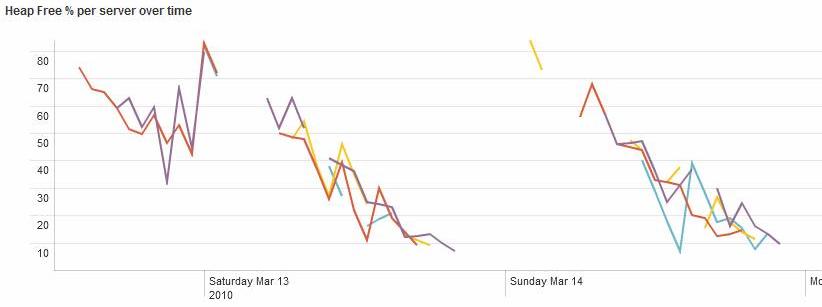
I'd also asked for jstat data which confirmed that the servers were filling up their heaps. I also found that the WebLogic logs contained some BEA-310002 messages that shed some light on the behaviour of the problem over a longer period. I used splunk to produce a graph from these:-


This graph seemed to indicate that the problem was related to the uptime of the servers rather than the amount of work they were doing (the behaviour was the same on a Sunday as on a working day). This prompted an idea for improving the stability of our system - avoid restarting all of the servers at the same time and then there would be a good chance that they wouldn't all fail at the same time. Unfortunately the change control procedures for the production system pretty much ruled this out, so we were stuck with restarting the servers each time they ran into trouble.

Finally Oracle support came back to us with the advice that this was a known bug in WebLogic for which a patch was available - 'BUG 8160383 - [CR368242]'. We applied this fix, tested it and put it into production and found that the problem was solved.

So I then wondered why we hadn't found the cause sooner. The Oracle support people said that the description of the patch said that it fixes "leaking objects weblogic.jms.dd.DDMember". I went back into Metalink and looked up the information relating to the bug and the patch and found that it contained mostly blank text and no mention at all of 'DDMember' which is probably why I couldn't find it. I wonder whether some of the information was perhaps lost in the transition from WebLogic's bug database into Metalink. Clearly the Oracle support people have another source of information available to them.