This particular issue took a long time to resolve because it wasn't in code that we controlled and tracking down information about the problem proved very difficult.
weblogic.jms.dd.DDMember
After clustering our WebLogic 9.2 servers we found that the managed servers would run into major heap stress and sometimes go offline on some of our test environments. Unfortunately the problem was not easily reproducible and didn't seem to happen on environments that we could easily mess with.
A heap histogram from jmap looked like...
255076744 2969890 char[]
71728608 2988692 java.lang.String
34196104 287745 * ConstMethodKlass
30874880 385936 weblogic.jms.dd.DDMember
20721808 287745 * MethodKlass
18528600 772025 weblogic.jms.common.JMSID
18527736 771989 weblogic.messaging.dispatcher.DispatcherId
15454080 386352 weblogic.cluster.BasicServiceOffer
14538712 24883 * ConstantPoolKlass
12604000 259169 * SymbolKlass
10601304 24883 * InstanceKlassKlass
9763528 29806 byte[]
9262056 385919 weblogic.jms.dd.DDMemberStatusSharer
7797008 18852 * ConstantPoolCacheKlass
6628720 118370 org.codehaus.groovy.runtime.metaclass.MetaMethodIndex$Entry
6175856 385991 weblogic.jms.common.JMSServerId
We also got some heap dumps, but it was pretty obvious from the outset that the memory leak related to WebLogic internal classes. We checked and ruled out the obvious things that were under our control (e.g. too many messages building up in JMS queues). We also googled for the problem and searched Oracle Metalink but didn't turn up any useful advice. The only option left was to raise a case with Oracle, which is what we did.
Oracle responded to the case with the advice to increase the heap size to 2Gb on all servers. We did this and our test environments became more stable. the problem did not recur in test so eventually the clustering changes made it into production.
I'm sure that you can guess where this story is going ...
After clustering went live we found that the managed servers would stay up for roughly 24 hours before running into problems and needing to be restarted. The initial symptoms that were noticed were BEA-000115 messages (which say that a multicast packet was lost) and BEA-000511 messages (which say unsolicited reply), along with high CPU utilisation.
Naturally a new Oracle case was opened. Initially it was thought that the problem was being caused by a poor choice of multicast addresses. Another week went by while the system was reconfigured with what seemed to be better multicast addresses, but still the problem remained.
I did some analysis of the logs using Splunk (a great tool BTW, but that's another story) and found that the messages seemed to appear in bursts starting an hour or two before the CPU utilisation became really high. Here is a Splunk graph showing the occurrences of one of the message types.

I'd also asked for jstat data which confirmed that the servers were filling up their heaps. I also found that the WebLogic logs contained some BEA-310002 messages that shed some light on the behaviour of the problem over a longer period. I used splunk to produce a graph from these:-
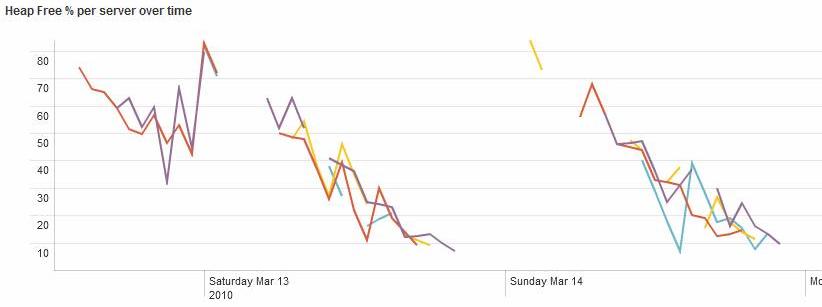
This graph seemed to indicate that the problem was related to the uptime of the servers rather than the amount of work they were doing (the behaviour was the same on a Sunday as on a working day). This prompted an idea for improving the stability of our system - avoid restarting all of the servers at the same time and then there would be a good chance that they wouldn't all fail at the same time. Unfortunately the change control procedures for the production system pretty much ruled this out, so we were stuck with restarting the servers each time they ran into trouble.
Finally Oracle support came back to us with the advice that this was a known bug in WebLogic for which a patch was available - 'BUG 8160383 - [CR368242]'. We applied this fix, tested it and put it into production and found that the problem was solved.
So I then wondered why we hadn't found the cause sooner. The Oracle support people said that the description of the patch said that it fixes "leaking objects weblogic.jms.dd.DDMember". I went back into Metalink and looked up the information relating to the bug and the patch and found that it contained mostly blank text and no mention at all of 'DDMember' which is probably why I couldn't find it. I wonder whether some of the information was perhaps lost in the transition from WebLogic's bug database into Metalink. Clearly the Oracle support people have another source of information available to them.

