For those not familiar with Camel you can find an overview here
To figure out how to make these measurements I set up a couple of sample contexts and routes and deployed them into a WebLogic 10.3 server. For no particularly good reason, both provide a service based on the Spring Web Services echo sample.
One route is based on the Camel CXF sample and uses a CXF endpoint, a custom transformation bean and a custom backend bean to generate the response.

The second route uses the Camel HTTP components to provide a servlet and then proxy the SOAP call to the same app running on another (Jetty) app server.

What we need to measure is:-
- how many times is each component/route called in a given time period?
- how long does each route take to respond back to the client?
- where is the response time being spent? - in our own components or in calls to other systems?
JMX
I was pleasantly surprised to find a bunch of Camel related JMX MBeans appear in the JRMC console without any need for me to make any changes to the application. Camel enables JMX by default and it seems that it also creates some usable default MBeans for each component.

Browsing through these it seems that most of them relate to the configuration of the Camel components rather than their runtime behaviour. Some of these include options to turn tracing on or off and reconfigure the detail level - useful but not quite what we are looking for. The two relevant parts of the tree for performance measurement are 'routes' and 'processors' because both of these contain invocation counts and timings. As their name suggests, 'routes' relates to the behaviour of the entire route and 'processors' to the behaviour of some individual components. The 'processors' tree doesnt cover every component - things like servlets that receive messages via HTTP and initiate the route processing are not available here, but their response time will in most cases equate to the response time of the whole route.
Below is a screenshot of one of the components in my proxying route showing the attributes that will alow us to monitor the number of invocations and response time. You can see the two custom MBeans in the echo_context route and the HTTP client in the servlet_echo_context route. Unfortunately the names of the MBeans don't seem to be very meaningful, but by browsing into the attributes it is usually possible to figure out which one is which. The attributes provided by the route level MBean are very similar.

We can therefore use JMX to monitor the performance of our Camel routes and individual components.
If you press the 'Visualize' button, you can also chart the value of one or more MBean attributes to see how they change over time. The chart will appear on the 'General' view in the console, soomething like the one below...

(Incidentally, if you want to graph behaviour over time and be able to zoom in and out etc then I think that Wily Introscope does a much better job - see my post comparing JRMC and Wily)
I noticed one bit of strangeness - the HTTP client MBean seems to report double the number of invocations that I would expect - each time the route runs the HTTP client's 'ExchangesTotal' count goes up by two.
Profiling Traps
The JMX MBeans will probably serve most of our day to day needs, but sometimes I expect we will want to 'drill down' a bit further to investigate performance issues. For this purpose, we can place traps or probes into the code which can make measurements at a level of detail lower than those provided by JMX.
These traps can be inserted using Aspect Oriented Programming technologies such as aspectj, Spring's built in AOP capabilities or using a monitoring tool such as Wily or JRMC.
If you want to use this approach, you need to have some knowledge of the code of the framework that you are using. You can get this by browsing the Javadocs or the source code itself or by running your app in a debugger, placing breakpoints at 'interesting' places and examining the call stack. Setting up a debugger takes some time, but I think it provides the answers that I want more quickly than trying to figure things out from the documentation or the source.
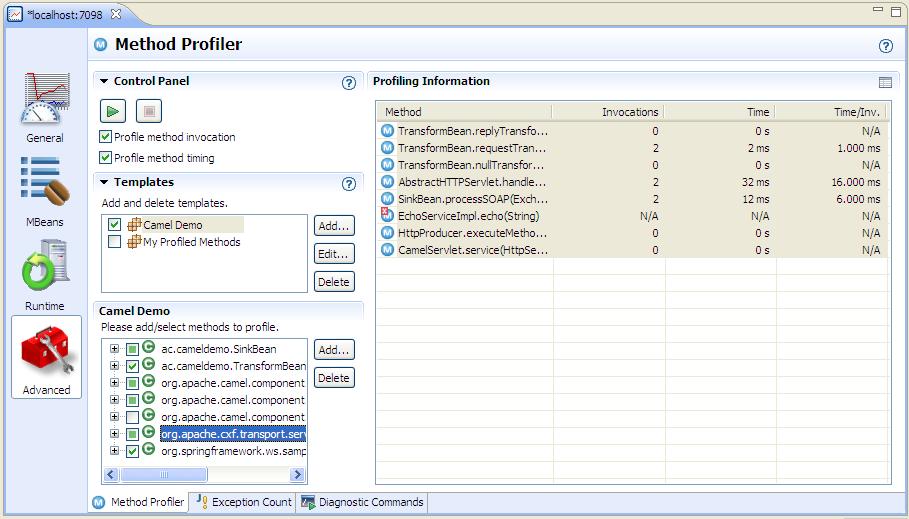
Here are some methods where I've placed traps to try out this technique...
- org.apache.cxf.transport.servlet.AbstractHTTPServlet.handleRequest(HttpServletRequest, HttpServletResponse) - The entry point into my CXF driven route
- org.apache.camel.component.http.CamelServlet.service(HttpServletRequest, HttpServletResponse) - The entry point into my HTTP servlet driven route
- org.apache.camel.component.http.HttpProducer.executeMethod(HttpMethod) - The point where my HTTP servlet driven proxying route calls out to an external server
- my own custom bean methods
Creating profiling traps in JRMC is fairly simple - go to the 'Advanced' view in the console and click the 'Add...' button under 'select methods to profile. JRMC will ask you for the class name. Assuming that the class is found, it will then allow you to select the methods that you want to profile.
Once the methods are selected, you need to click the 'Start Profiling' button (green triangle) to start capturing data. You should see something like the screenshot below.
Profiling traps can be used to get a more detailed picture of where response time is being sent. They are more complex to set up than JMX and probably incur some measurement overhead. They do have one other big drawback - they are based only on class and method, so you won't be able to separate out the stats for different component instances if you have a number of routes using the same type of component. For all of these reasons, method profiling is probably best restricted to very targeted tests in which you can focus your workload and your profiling traps purely on a small area of interest.

